matplotlib-subplot
1 min
Some things I discovered today
Subplot Spacing Adjustment
From https://blog.csdn.net/qq_33039859/article/details/79424858
plt.subplots_adjust(left=None, bottom=None, right=None, top=None,
                wspace=None, hspace=None)
left  = 0.125  # the left side of the subplots of the figure
right = 0.9    # the right side of the subplots of the figure
bottom = 0.1   # the bottom of the subplots of the figure
top = 0.9      # the top of the subplots of the figure
wspace = 0.2   # the amount of width reserved for blank space between subplots,
               # expressed as a fraction of the average axis width
hspace = 0.2   # the amount of height reserved for white space between subplots,
               # expressed as a fraction of the average axis height
Shared Axes
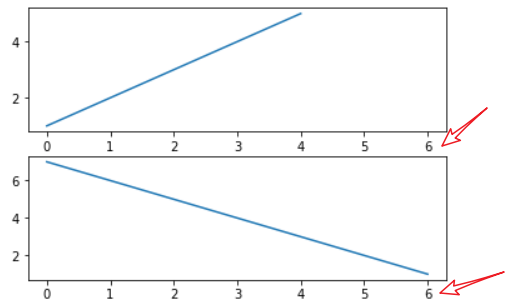
When you create an Axes using pyplot.subplot(), pyplot.axes() functions or Figure.add_subplot(), Figure.add_axes() methods, you can pass another Axes through the sharex keyword argument to share the X-axis; or pass another Axes through the sharey keyword argument to share the Y-axis. When sharing axes, when you zoom one Axes, the other Axes will also zoom accordingly.
fig = plt.figure()
ax1 = fig.add_subplot(211)
ax1.plot([1,2,3,4,5])
ax2 = fig.add_subplot(212, sharex=ax1)
ax2.plot([7,6,5,4,3,2,1])